

A recursively partitioned mixture model for clustering time-course gene expression data
Introduction
Studies involving the collection of microarrays over a time-course are necessary for understanding the dynamic nature characteristic of biological systems. In the context of gene expression data, such studies enable the investigation of temporal profiles of gene expression during a given biological process, and in doing so, provide valuable insight about how gene expression levels evolve over time as well as the nature of gene dependencies during a given biological process (1). For a given clinical outcome (i.e., disease onset), expression measurements collected longitudinally on initially disease-free subjects may allow one to distinguish causal genomic features from consequential ones. Additionally, if environmental influences or other exposures are recorded, it may be possible to relate these to changes in genomic features, thereby illuminating the path from exposure to disease on a molecular level. Such insights are not possible using microarrays collected cross-sectionally, i.e., from a static viewpoint, underscoring the importance of temporal microarrays and the companion need for appropriate analytic tools to assist in furthering our understanding of molecular biology.
Due to the large number of genes profiled in a typical microarray experiment and the increasing interest in the study of groups of subjects with similar expression profiles, unsupervised clustering of subjects has emerged as one of the most popular statistical methods for analyzing such data. A vast array of unsupervised clustering algorithms have been proposed for clustering gene expression data, including hierarchical clustering (2), K-means clustering (3), self-organizing maps (4), and model-based clustering using Gaussian mixture models (5). Although there is no universal consensus on the “best” method for gene expression data, a recent study examining the performance of 7 different commonly used clustering algorithms on 35 different cancer gene expression data sets revealed that a Gaussian-distributed finite mixture model, followed by K-means, exhibited the best performance in terms of recovering the true structure of the data sets (6). Along the lines of model-based clustering via mixture models, Houseman et al. [2008] proposed a model-based recursive-partitioning algorithm to navigate clusters in a beta mixture model (7), although this method has also been extended for navigating clusters in a Gaussian mixture model (8). This method, termed the Recursively Partitioned Mixture model (RPMM), has been extensively applied for clustering large-scale genomic data (9-13) and is freely available as a package ‘RPMM’ in the Comprehensive R Archive Network (CRAN).
The aforementioned methods have proved to be successful strategies for unsupervised clustering analysis of large-scale genomic data, however they lack a formal framework for modeling the characteristics unique to microarray data collected over a time-course. As described by Luan et al. [2003], one important characteristic of such data is the possible dependency of gene expression levels across time for a given gene (1). Furthermore, gene expression levels are dynamic with respect to time. Methods that capture the dynamic changes in gene expression over time while accounting for anticipated autocorrelation between successive expression measurements are crucial for clustering longitudinally collected microarray data. Coffey et al. [2011] provide a review of functional data analytic (FDA) techniques for analyzing time-course microarray data (14). Such techniques represent the entire sequence of measurements for an individual expression profile as a single function—the resulting functions are then used for subsequent clustering of genes. For example, a mixture of mixed-effect models using B-splines for the clustering of genes has been proposed (1). While these approaches have been successful for the clustering of genes, we seek a method for clustering subjects on the basis of their individual gene-expression trajectories, with the goal that resulting clusters will provide insight regarding phenotypic or exposure related disparities between subjects. Hence, our data consists of J × Ti matrix of gene expression levels across time for each of N subjects , where J denotes the number of genes profiled and Ti represents the number of time-points gene expression data was collected for the ith subject. Although the present version of RPMM has many desirable properties, its current formulation relies on an assumption of class-conditional independence of genes and subjects. Therefore, RPMM may be inappropriate for repeated-measure data, for which within-subject autocorrelation may be pronounced. Moreover, the existing RPMM methodology was designed specifically for clustering subjects on the basis of static microarray data and therefore lacks a formal framework for clustering subjects on the basis of their gene-expression trajectories.
As a result of the above limitations, we seek an adaptation of RPMM that: (I) directly accounts for the within-subject dependencies in repeatedly measured gene expression data and (II) clusters subjects on the basis of their longitudinal profile of gene expression. In addition, the proposed framework should admit irregular spacing of microarray measurements, which is common in longitudinal microarray studies involving human subjects. Along the lines of Luan et al. [2003], we propose a method called time-course RPMM (TC-RPMM) that utilizes a mixture of mixed-effects model framework for modeling the time structure and time dependence of individual gene expression measurements that are repeatedly measured over time. Within this framework, TC-RPMM permits the clustering of subjects on the basis of their temporal profiles of gene expression across a collection of genes.
The outline for the remainder of this paper is as follows: in the Methods section we provide an overview of RPMM and the proposed TC-RPMM method, as well as summary of the data set used in our data application. In the Results we report our findings for both the simulation studies and data application. We finish with a discussion of our study results and provide a summary of the limitations and possible extensions of our approach.
Methods
Finite mixture models and RPMM
We begin by providing a brief overview of the conventional mixture model formulation as well as RPMM, as these serve as the foundation for the proposed modified TC-RPMM. Interested readers may refer to Houseman et al. [2008] for a more comprehensive description of RPMM.
For static gene expression data from subject at gene , we assume the distribution , where is a vector of parameters that depends on both class k and gene j. Houseman et al. [2008] assumed beta-distributed responses, however in general any parametric distribution could be used—for appropriately transformed gene expression data (i.e., log2-transformed), we assume Gaussian-distributed responses. Hence,
where . Under the assumption that with probability ηk, where , and that expression of each gene is independent conditional on class membership, the likelihood contribution from subject i is given by:
where is a vector of parameters and is a vector of gene expression measurements for subject i. Thus, conditional on class membership , the above formulation effectively assumes the following model for
where , for . Hence, with observed data , the conventional mixture model approach involves maximizing the full-data log-likelihood,
with respect to, which can be easily achieved using the Expectation-Maximization (EM) algorithm (15). Briefly, this involves initializing the procedure with an N × K matrix of weights whose rows sum to one, where the rows reflect initial guesses at class membership probabilities across for each subject. Thus, for each k, we set and maximize the Eq. [4] with respect to ϑ. At each iteration we recompute weights
and iterate until does not change. The final weight, represents the posterior probability that subject i belongs to class k.
One of the fundamental issues in problems involving clustering is the selection of the number of classes K (16). Since the number of classes K is typically unknown, one might decide on the number of classes by fitting mixture models for a range of possible values of K, computing the resulting BIC statistics and selecting the value of K that corresponds to the minimum BIC. The entire operation has approximate complexity , where Kmax is the maximum number of classes attempted. Houseman et al. [2008] proposed a recursive alternative to conventional mixture model approach based on a weighted-likelihood version of Eq. [4] that typically has complexity no more than NJKlogK. Briefly, RPMM recasts the conventional mixture model formulation into a hierarchical framework [a model-based version of the HOPACH algorithm (17)], where the first step of RPMM, representing the top of the tree, involves fitting a 1-class model to the entire dataset. The BIC from the resulting model is then computed and compared to the BIC resulting from a 2-class mixture model fit to the entire data (first branch of the tree). If the BIC from the 2-class model is less than the BIC from the 1-class model, we continue recursion. Under the assumption that the resulting classes from the previous 2-class model can be further split, and that each subject belongs to the subsequent splits only with probability equal to the weight assigned from the previous split, the weighted-likelihood EM algorithm is applied recursively to obtain two new classes (next branch in the tree). As before we compare the BIC from the previous split to the new split and continue recursion if the BIC from the new split is less than the BIC from the previous split, suggesting a more parsimonious representation of the data. As previously described, recursion can be terminated early if the split leads to a less parsimonious representation of the data or if the classes under consideration comprise a small number of pseudo-subjects. The later is used as a safeguard, due to the fact that mixture models become unstable with small weights (representing a small number of pseudo-subjects).
The final clustering solution consists of K classes with the final assembled from the individual vectors , as well as the posterior probabilities of class membership for each subject across each of the terminal classes.
Time-course RPMM
One major limitation of the existing RPMM framework is that the underlying model described in Eq. [3] is not suitable for microarray data collected over a time-course due to the anticipated autocorrelation between repeated measurements on the same subject; nor does it capture the relationship between gene expression as a function of time. As above, we shall assume that subjects belong to one of K possible classes, which are characterized by the temporal patterns of gene expression across J different genes. Letting Yijt represent the gene expression measurement for gene at time for subject ,
where
We note that in the above model can be specified to assume different structures (i.e., compound symmetric, autoregressive, Toeplitz, etc.) depending on the nature of the data, allowing for additional flexibility in modeling time-course microarray data. We further note from [6] that in most scenarios is a either a vector of ones, indicating a random intercept only model, or a matrix , indicating a random intercept and slopes model. In principle, nonlinear trajectories could be addressed by the incorporation of higher-order polynomial terms or B-splines (1).
Within the mixture model framework, assuming that subject i belongs to class k, , with probability , and and that the expression of different genes are linearly independent conditional on class membership, the likelihood contribution from subject i is given by:
where is a matrix, is a multivariate normal distribution with mean and variance-covariance matrix , , and is a vector of model parameters.
Hence, with observed data , we then maximize the full data log-likelihood given above,
with respect to ϑ. The likelihood contribution for subject i can then be readily integrated within the current RPMM framework as summarized above. Specifically, in the first step of TC-RPMM a 1-class model is fit to the entire dataset and the BIC for this model is computed. The BIC form the 1-class model is then compared to the BIC resulting from a 2-class mixture model fit to the entire data (first branch of the tree). If the BIC from the 2-class model is less than the BIC from the 1-class model, we continue recursion, successively splitting the data and comparing the BIC from new splits of the data to BIC computed from the previous split. As previously mentioned, this process is terminated if the splitting classes leads to a less parsimonious representation of the data (i.e., where r is an index for the recursion sequence) or if the classes under consideration comprise a small number of pseudo-subjects. Thus, The final clustering solution consists of K classes estimated recursively using the procedure describe above, , and posterior probabilities of class membership for each subject across each of the K terminal classes (i.e., ).
One other important difference between RPMM and TC-RPMM involves the initialization of the N×K matrix of weights . As previously described, the rows of represent initial guesses at class membership probabilities for each subject. In the existing RPMM, is initialized using a fuzzy clustering algorithm, such as the fanny algorithm (19) available in cluster R-package. Since time-course microarray data is characterized by multiple measurements on the same genes repeatedly throughout time, there are several options for initializing for the proposed TC-RPMM. The first option involves fitting the fanny algorithm to the subjects under consideration using their average gene expression values over time (i.e., for subject i and gene j), however this is limited in that the rate of change of gene expression measurements of time is not taken into account. In the second option, the fanny algorithm is fit to the subjects under consideration using gene-specific random intercepts and slopes. In particular, using the best linear unbiased predictors (BLUPs), obtained from fitting a series linear mixed-effects models to each of the J genes used for clustering analysis. We recommend the later option as it is more in line with the philosophy of our overall approach and because it tends to result in faster EM-convergence compared to the first option. Other options for initializing the weight matrix in this context are described elsewhere (20).
Description of the Glue study data
We implemented simulation studies and an analysis of a real biological time-course microarray data set to investigate the performance and application of the proposed TC-RPMM. The simulation studies as well as our data application utilized time-course microarray data acquired from the Glue Project consortium (www.gluegrant.org). Briefly, this data set consisted of time-course gene expression data collected on 140 patients, admitted to one of eight participating institutions, between 2004 and 2010. As described in Rajicic et al. [2010], the Glue study entry criteria included patients who had suffered a blunt trauma without isolated head injury, who had arrived at a hospital within 6 hours of the injury, and had either hypotension or an elevated base deficit (21). Subjects with anticipated survival of less than 24 hours, significant pre-existing organ dysfunction, or severe traumatic brain injury were excluded from analysis. Blood was sampled at 12 hours and at 1, 4, 7, 21 and 28 days after the blunt trauma and was hybridized to an Affymetrix HU133 plus 2.0 gene chip, which profiles the expression status of 54,676 unique probe-sets. The details of the clinical protocol and sample processing have been previously described (22). As in Rajicic et al. [2010], respiratory recovery, the primary outcome of interest in our data application, was defined as a patient’s ability to breathe on their own after the removal of mechanical ventilation. The maximum follow-up time was 28 days, with patients who had not recovered by 28 days treated as censored with respect to respiratory recovery. Written informed consent was obtained from all patients or their legally authorized representative.
Preprocessing steps for the Glue study data
Gene expression measurements were extracted from oligonucleotide probes by a perfect-match model using dChip software (www.dChip.org). Gene expression values were log-transformed prior to any calculations. We implemented several steps to reduce the dimensionality of the microarray. First, we excluded probe-sets labeled “Absent” over all arrays. “Present/Absent” labels for the Affymetrix HU133 plus 2.0 gene chip indicate whether a probe-set was reliably detected or not for a particular array. This step reduced the number to 48,992 probe-sets from 54,676 probe-sets. Under assumption that genes exhibiting temporal changes are potentially related to the time-to-respiratory recovery, we next excluded probe-sets with a “low’ sample coefficient of variation, which was defined as having a coefficient of variation below the sample median. This reduced the number of probe-sets to 20,455, which represented the final set of probes that were used in subsequent analyses.
Results
Simulation studies
We conducted a variety of simulation studies aimed at understanding the performance of TC-RPMM. To understand the sensitivity of TC-RPMM for recovering true class membership for varying numbers of true underlying clusters/classes, simulation studies were conducted where the true number of classes was equal to 2, 3, and 4, i.e., K = {2, 3, 4}. For each of the true number of classes, longitudinal gene expression data was simulated for a total 100 genes (i.e., J =100). In the simulations where K =2, longitudinal gene expression data was simulated for a total of 50 subjects (25 subjects per class), when K =3 longitudinal gene expression data was simulated for a total of 75 subjects (25 subjects per class), and when K =4 longitudinal gene expression data was simulated for a total of 100 subjects (25 subjects per class). We were also interested in the performance of TC-RPMM in recovering true class memberships when the fraction of discriminating genes was varied. By discriminating genes, we are referring to genes whose expression trajectory differed between the classes (further details to follow). To this end we considered simulations where the fraction of discriminating genes ranged from 0-100%; specifically, 0%, 10%, 30%, 50%, 70%, 90%, and 100%.
Because our model assumes a linear relationship between gene expression measurements and time (i.e., the intercept and slope parameters govern the expression trajectory of a given gene), our data were simulated under three different general scenarios: (I) scenario 1, the intercepts of discriminating genes differ between classes, but their slopes are the same; (II) scenario 2, the slopes of discriminating genes differ between classes, but their intercepts are the same and (III) scenario 3, both the slopes and intercepts of discriminating genes differ between the classes (Table 1).

Full table
For the class discriminating genes, longitudinal gene expression data were simulated from a multivariate normal distribution with mean and variance-covariance (i.e., compound symmetric). Here, refers to a design matrix, whose first column is a vector of ones and whose second column is a vector of the time points at which microarray data was collected for subject
In addition to evaluating the performance of the proposed TC-RPMM, we also benchmarked its performance against two versions of the standard RPMM and two versions of K-means clustering. Here, “standard” RPMM refers to a Gaussian-distributed RPMM as described in Houseman et al. [2008]. The motivation behind using K-means and Gaussian-distributed RPMMs as a basis of comparison is that collectively, they comprise both non-parametric and model-based clustering methods. Moreover, their selection is driven by recent work showing that model-based clustering via a finite mixture of Gaussians, followed by K-means, demonstrated the best clustering performance in a recent comparison of various clustering methodologies across 35 different gene expression data sets (6). Among the two versions of a standard RPMM considered, the first version involved applying the standard Gaussian RPMM to cluster subjects using their gene expression data for the first time-point only (i.e., baseline gene expression measurements), whereas the second approach involved the use of a standard Gaussian RPMM to cluster subjects using their average gene expression over time. We hereafter refer to these approaches as Time0RPMM and AvgRPMM, respectively. We also compared TC-RPMM to two approaches based on K-means clustering, Time0Kmeans and AvgKmeans, which are similar to the Time0 and Average RPMM methods described above, substituting K-means clustering for RPMM. When applying K-means clustering, we assumed that the true number of clusters was known; that is, K was correctly specified for each of the K-means clustering approaches.
We considered 100 simulations for each of the simulation scenarios described in Table 1. For each simulation scenario, we assessed the extent to which the Time-Course, Time0, and Average RPMM methods were capable of correctly identifying true class membership on the basis of their gene expression trajectories.We used the Adjusted-Rand Index to assess the similarity between predicted and true class membership, as this method provides measure of the similarity between two data clusterings (i.e., predicted classes versus true classes) corrected for chance (23). The maximum value of the Adjusted-Rand Index is 1.0, suggesting perfect concordance between two data clusterings. With respect to the linear mixed effects model that serves as the backbone for TC-RPMM (Eq. [6]), we assumed a random intercept only model and that .
Figures 1 and 2 depict the average Adjusted-Rand Index for each of the considered methods across the three different simulation scenarios. As noted from Figure 1, when the true number of classes was equal to 2, TC-RPMM tended to outperform each of the considered methods across all considered simulation scenarios. Not surprisingly, the degree to which TC-RPMM was able to recover true class membership is strongly related to the proportion of discriminating genes used in clustering analysis. However, when the true number of classes was equal to 2, TC-RPMM was able to reliably recover true class membership when the slopes and intercepts of as little as 10% of the genes differed between classes (Figure 1; Scenario 3). Also, not surprisingly, both the Time0RPMM and Time0Kmeans methods performed well in scenarios 1 and 3 (Figures 1 and 2). This is anticipated as both of these scenarios are characterized by differing intercepts in discriminating genes between classes and therefore differing baseline measurements of gene expression; situations for which these methods are well-suited to detect class separability. In these scenarios we note the tendency of K-means to outperform RPMM. This might be expected since K-means benefits from correct specification of K, whereas K is estimated in the RPMM framework.


When the true number of underlying classes is slightly larger (i.e., K =3 and 4) the Time0RPMM and Time0Kmeans methods exhibit a slight edge over TC-RPMM in terms of correctly identifying true class membership when the fraction of discriminating genes is less than 70% for scenario 1 (Figure 2). However, as we might expect, these methods perform poorly in scenario 2 when the intercepts of discriminating genes are the same between classes but their slopes differ. In Figure 2 it is also evident that degree to which TC-RPMM is able to recover true class membership strongly related to the proportion of discriminating genes used in clustering analysis. This highlights the importance of feature selection as a first step prior to clustering analysis. It is also worth noting that on average, TC-RPMM took 2.3, 4.0, and 4.0 minutes to converge when the true number of underlying classes was 2, 3, and 4, respectively. Details regarding the specifications of the computing cluster used for our simulation study can be found at the following web address (http://www.acf.ku.edu/wiki).
In addition to assessing the ability of TC-RPMM for recovering true class memberships across the various simulation scenarios, wse were also interested in its ability to correctly predict the true number of classes K and the accuracy of TC-RPMM in terms of the estimation of the fixed-parameters that defined each of the classes [i.e., ]. As noted in Figure 3, for simulation scenario 3 TC-RPMM correctly predicted the true number of classes nearly one-hundred percent of the time when the number of discriminating genes was at least 30%. Although there is some attenuation of TC-RPMMs performance for simulation scenarios 1 and 2, generally speaking when the fraction of discriminating genes is at least 50% TC-RPMM tends to perform well with regard to correctly estimating the true number of classes (Figure S1, Figure S2, Figure S3). We also observed that across the simulation scenarios and number of underlying classes, TC-RPMM tended to result in unbiased estimates of the fixed-parameters (Figure S4, Figure S5, Figure S6).

We also conducted simulation studies to examine the robustness of TC-RPMM to misspecification of the underlying distribution for the longitudinal gene expression data. Along these lines, longitudinal gene expression data were simulated similar to that previously described (Table 1) using a multivariate T-distribution with low degrees of freedom (df =5) instead of a mulitvariate normal distribution (MVN). The results from this analysis are given in Figure S7, Figure S8 and demonstrate the robustness of TC-RPMM to misspecification of the underlying data generation model. Similar to the results obtained when the data were simulated from a MVN (Figures 1,2), TC-RPMM performs well across all scenarios in terms of correctly recovering true class memberships, the degree depending on the fraction of discriminating genes.
Lastly, since our previous simulations involved generating longitudinal gene expression data from a MVN with a compound symmetric covariance structure, we also conducted additional simulation studies where expression data was simulated from a MVN with an autoregressive order 1 [AR(1)] covariance structure; a potentially more likely covariance-structure for data obtained in a real longitudinal study of gene expression. The correlation between gene expression measurements at time points s and t was assumed to be , where ϕ=0.5 and ϕ=0.9 were both considered. Generally speaking, increased autocorrelation between successive gene expression measurements (i.e., as ϕ was increased toward 1) corresponded to an increased ability of TC-RPMM to accurately recover the true class memberships of the subjects being clustered (Figure 4).

Data application
Because our simulation studies demonstrated that TC-RPMMs ability to recover true class memberships depended heavily on the number of discriminating genes, underscoring the importance of feature selection prior to clustering analysis, and because a common objective of clustering is to identify clusters that associate with some phenotype(s) of interest, we utilized a semi-supervised feature selection strategy (11) for identifying clusters that associate with time-to-respiratory recovery. Figure 5 depicts a diagram illustrating our semi-supervised procedure, as applied to the Glue study data. The first step involved randomly splitting the full Glue study data set into equally sized training and testing sets. Hence, there were 70 subjects randomly allocated to both the training and testing sets. The purpose of the training data is to train a classifier, which is then subsequently validated using the remaining observations in the independent testing data set. After randomly splitting the full data in to a training set and independent testing set, we examined the association between expression trajectory and time to respiratory recovery for each of the 20,455 probe-sets using the training data only. Since microarray data were collected over a time-course in the Glue study, thus giving rise to time-dependent measurements, we utilized the method of Rajicic et al. [2006] for testing the association between expression trajectory and time to respiratory recovery (24). Briefly, this method utilizes a random effects model for imputing missing data at the time of an event by modeling unknown values using measurements up to that time. We thus obtained test-statistics for each of the 20,455 probe-sets, where each test-statistic reflected the extent to which expression levels associated with the time-to-respiratory recovery. We then ranked the probe-sets on the basis of the absolute value of their test-statistics and selected the top five probe-sets for subsequent clustering of the training data via the proposed TC-RPMM. The number of top ranking probe-sets used for clustering the training data (in this case 5) was selected using the nested cross-validation procedure described in (11). As in our simulation studies, we assumed a random intercept only model and independent serial correlation structure (i.e., ). Applying the specified TC-RPMM to the training data using the 5 probe-sets whose expression trajectory was most significantly associated with time to respiratory recovery resulted in two predicted classes. Based on the parameter estimates obtained from the TC-RPMM solution fit to the training data, a naive Bayes procedure (7) was used to predict class membership for the observations in the testing set using the same 5 previously identified probe-sets. We then assessed the association between the predicted classes in the testing data and time to respiratory recovery to determine the utility of five identified probe-sets in defining phenotypically important classes. The Kaplan-Meier curves stratified by predicted class for the observations in the testing set are given in Figure 6 and show considerable differences in time to respiratory recovery between the two predicted classes. As noted in Figure 6, the median time-to-respiratory recovery for subjects predicted to be class 1 was estimated to be 9 days, which is significantly longer than the estimated median survival for subjects in class 2, 3-day (log-rank P value <0.0001).


As there are a number of factors that are capable of confounding the association between predicted class and time to respiratory recovery, we also fit a Cox-proportional hazards model (25) to examine the association between predicted class in the testing data, controlled for age, gender, and injury severity score (ISS). In the Glue study, the ISS was assessed for each patient upon hospital admission and represents an anatomical scoring system that provides an overall score for patients with multiple injuries. The ISS takes on values from 0-75, with larger scores representing more severe injuries. As noted in Table 2, predicted class membership in the testing data remained significantly associated with time to respiratory recovery adjusting for potential confounders.

Full table
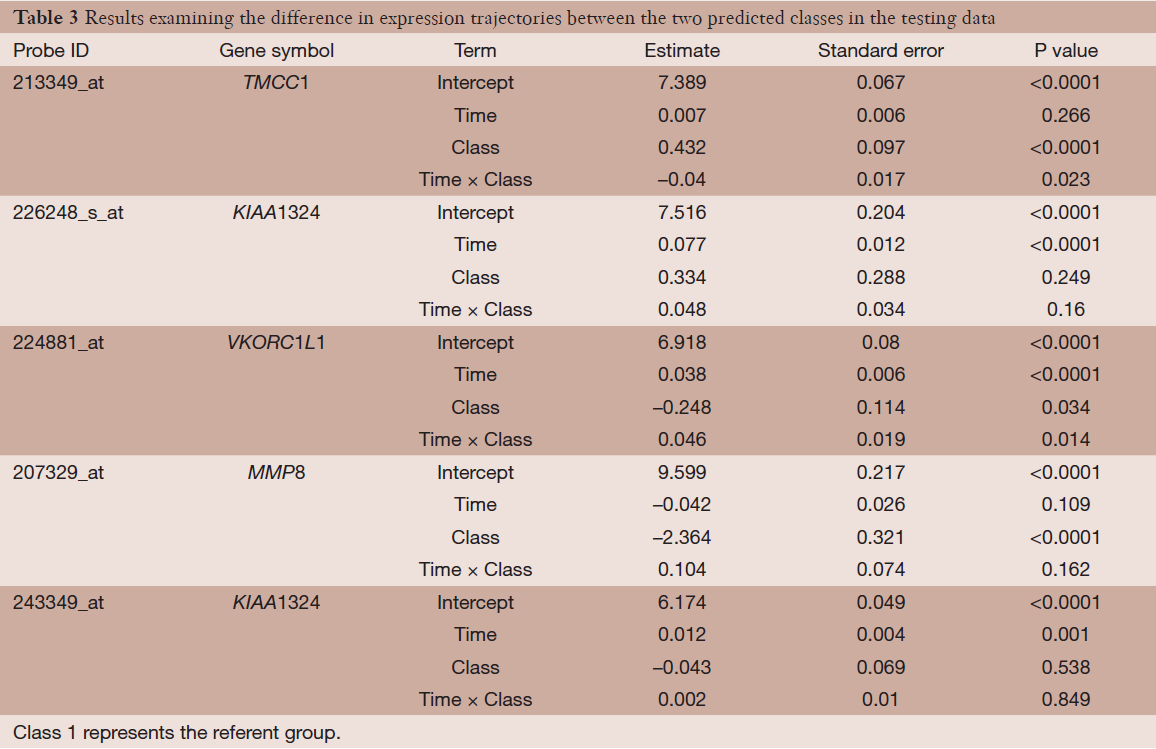
Lastly, we examined the differences in expression and expression trajectories between the two predicted classes in the testing data among the five identified probe-sets from the semi-supervised TC-RPMM clustering analysis. This was accomplished by fitting a random intercept model to the testing data with main effect terms for predicted class and time as well as the interaction term between time and predicted class. The results of this analysis are given in Table 3, and show statistically significant differences in expression and expression trajectory between the two classes for a number of probe-sets. The subject-specific expression trajectories and estimated expression trajectories for the observations in the testing data are given Figure 7. As noted from Table 3, probes 213349_at, and 224881_at (associated with genes TCMM1 and VKORC1L1, respectively) were associated with significant differences in both baseline expression as well as expression changes over time between the two predicted classes. Moreover, we noted that Class 2 had a significant decreased expression of probe 207329_at, which is associated with gene MMP8. Although there were no significant differences in baseline expression or changes in expression over time between the two predicted classes for probes 226248_s_at and 243349_at (both associated with gene KIAA1324), the expression of both probes increased significantly over time.
Full table

Discussion
While studies utilizing large-scale microarray data collected from a static viewpoint have contributed greatly to our understanding of molecular biology, temporal microarrays offer a unique opportunity to examine the dynamic behavior of gene expression, providing additional insight surpassing that which can be gleaned from static microarray data. Although the literature abounds with statistical methodologies for static microarray data, methods for temporal microarray data are generally lacking. While methods have been proposed for detecting expression changes over time within a single biological group or expression changes over time between two or more groups (26), much less work has been done to address the issue of clustering time-course microarray data. Moreover, the work that has been done with respect to clustering time-course microarray data has mostly focused on the clustering of genes to determine groups of co-expressed genes with respect to their temporal expression patterns. As is often the case with static microarray data, interest is often centered on the clustering of subjects on the basis of their genomic features and the subsequent study of the phenotypic disparities between the resulting classes. With this in mind, we sought to develop a methodology for clustering subjects based on time-course microarray data. Our approach for doing so is based on the philosophy that each subject belongs to a particular class, among set of classes that are uniquely characterized by differences in gene expression trajectories. We however note the existence of other philosophies for clustering subjects on the basis of time-course microarray data. For example, one other philosophy involves the notion that subjects can alternate between two or more classes throughout time. This so-called “Markov” philosophy has been explored (27) for clustering genes using temporal patterns in gene expression and represents an attractive option for the purposes of clustering subjects based on time-course microarray data. Our means of addressing the former philosophy involved a modification of the existing RPMM formulation, whereby we integrated mixed-effect model framework for characterizing temporal expression patterns. We note that the model-based nature of RPMM makes it relatively straightforward to deal with mixed-effects models in a way that would be challenging with nonparametric clustering methods. The proposed TC-RPMM allows one to cluster subjects on the basis of their gene expression trajectories and does not require “uniformly” sampled data, which are common in longitudinal studies involving human subjects. We note that the TC-RPMM is not intended to represent a forecasting or prediction methodology, wherein temporal patterns of gene expression are used to predict future outcomes, however treatment of this problem has been examined (28). The utility of the proposed methodology lies its ability to detect distinct classes that are characterized by the temporal patterns in expression across a number of different genes. Investigating the aggregate expression profiles within and between classes can offer valuable insight toward the underlying biological processes that drive phenotypic disparities between the resulting classes. Such information may then be able to guide the development of novel diagnostic tools and/or more targeted theraputics.
We investigated the performance of the proposed TC-RPMM using both simulation studies and a data application. The simulation studies encompassed several different scenarios and aimed to investigate the ability of TC-RPMM for correctly recovering true class memberships when the expression trajectories that characterized those classes differed. TC-RPMM was benchmarked against two variations based on the standard RPMM and K-means clustering—variations that are often used in practice for clustering time-course microarray data, due to the lack of methods with a framework capable of handling the complexities inherent to longitudinally collected microarray data. The results of our simulation studies demonstrated good performance of TC-RPMM in terms of accurately clustering subjects on the basis of their gene expression trajectories and showed that TC-RPMM remained robust to departures in the underlying data generation model. Importantly, our simulation studies highlight the inaccuracies and inefficiency of methods that do not appropriately account for the characteristics of time-course microarray data. Our simulation studies also demonstrated that TC-RPMMs ability accurately cluster subjects depended heavily on the number of discriminating genes; a testament to the importance of feature selection as prior to clustering analysis. While a full treatment of feature selection is beyond the scope of the present manuscript, we refer interested readers to (29-31).
The goal of our data application was to identify and validate profiles of temporal gene expression that are associated with time to respiratory recovery. To address this, we used a semi-supervised feature selection strategy coupled with the use TC-RPMM for clustering subjects on the basis of their longitudinal gene expression profiles. This analysis revealed two classes, which were defined by the temporal expression patterns of five unique probe-sets. As noted, Class 2 was associated with a significantly decreased time to respiratory recovery compared to Class 1 (log-rank P value <0.0001), which remained significant after adjusting for potential confounders (Cox-proportional hazards P value =0.003). Using the testing data set, an examination of the expression trajectories of the five identified probe-sets showed that several probes were associated with baseline differences in gene expression and/or differences in expression trajectories between the two classes. In particular, probes 224881_at and 207329_at, associated with genes VKORC1L1 and MMP8 respectively, have been previously implicated in wound healing processes and inflammation. Specifically, VKORC1L1, the paralog of VKORC1, has been suggested to have a synergistic relationship with SERP1 in eliminating reactive oxygen species (ROS) (32). The observation that ROS have been implicated in modulating inflammatory response under acute- and chronic-injury conditions (33) may explain the role of VKORC1L1 in defining classes with significantly different times to respiratory recovery. Additionally, MMP8 has been shown to play a crucial role in wound healing. In particular, inflammatory cells produce the necessary levels of MMP8 to complete the healing process (34). As a result of this finding, we would expect MMP8 to be over-expressed among subjects with more severe injury—explaining the significant over-expression of this gene among subjects in Class 1, which was characterized by longer times to respiratory recovery. Thus, there is strong biologic plausibility to the genes identified by the proposed methodology.
One consideration regarding the proposed TC-RPMM is that it explicitly assumes a linear relationship between gene expression and time. Although several studies have modeled expression changes of time under the assumption of linearity (24), it is certainly possible that temporal expression patterns exhibit a non-linear behavior. The extent to which this is true however, may largely depend on the time scale of the study under consideration as well as the particular genes that are profiled. For instance the expression data used in our application represented a relatively short-time frame (blood was collected at 12 hours, 1, 4, 7, 14, 21, and 28 days and subsequently profiled for gene expression). Although the expression patterns in this study were reasonably linear with respect to time (Figure 7), a study involving the examination of expression data over a longer time frame may be characterized by non-linear expression patterns over time. A possible solution to this issue involves the substitution of a non-linear mixed effects model for the linear mixed effects model in the proposed TC-RPMM. Alternatively, splines could be incorporated within the mixed effects model framework to treat the gene expression level as a continuous function of time without requiring the specification of a linear relationship. Possible options include B-splines (35) and smoothing splines (36), although the additional structure could add considerable computational burden. One other point of contention, which involves our data application, is that only time-course expression data up to the time of respiratory recovery was used for subsequent clustering. As such, it might be argued that final clustering solution is not reflective of true biological differences between the two groups, but rather driven by how much data was collected on a particular subject. We addressed this by refitting the TC-RPMM using all available microarray data for the subjects in our data, even if that data were collected post-respiratory recovery. The classes estimated from this analysis exhibited strong concordance with the previously estimated classes (Adjusted-Rand Index =0.8) and were similarly significantly associated with time to respiratory recovery (log-rank P value <0.0001). This suggests that the classes identified by our analysis are reflective of biological differences and are not driven by the amount of data collected for a particular subject.
Conclusions
In summary, the TC-RPMM methodology clusters subjects on the basis of their expression trajectory while allowing for correlation in repeated microarray measurements. Moreover, this approach does not require uniformly sampled data and therefore represents an attractive clustering methodology for clustering subjects based on time-course microarray data. R-code for implementing the proposed TC-RPMM is available from the first author by request.
Supplementary


Acknowledgments
We would like to extend our gratitude to Drs. Hernando Ombao, Zhijin Wu, and David Engler for valuable insights on the subject. Finally, we acknowledge the Inflammation and the Host Response to Injury consortia (www.gluegrant.org) for their data contribution.
Funding: This work was supported by the US National Institutes of Health grants (F31AG039190-01 to DCK), (R01 CA121147, R01 CA078609, and R01 CA100679 to KTK), the Flight Attendant Medical Research Institute (YCSA052341 to CJM) and a CTSA grant from NCATS awarded to the University of Kansas Medical Center for Frontiers: the Heartland Institute for Clinical and Translational Research # KL2TR000119.
Footnote
Provenance and Peer Review: This article was commissioned by the Guest Editors (Dung-Tsa Chen and Yian Ann Chen) for the series “Statistical and Bioinformatics Applications in Biomedical Omics Research” published in Translational Cancer Research. The article has undergone external peer review.
Conflicts of Interest: All authors have completed the ICMJE uniform disclosure form (available at http://dx.doi.org/10.3978/j.issn.2218-676X.2014.06.04). The series “Statistical and Bioinformatics Applications in Biomedical Omics Research” was commissioned by the editorial office without any funding or sponsorship. The authors declare no competing financial interests.
Ethical Statement: The authors are accountable for all aspects of the work in ensuring that questions related to the accuracy or integrity of any part of the work are appropriately investigated and resolved. The study was conducted in accordance with the Declaration of Helsinki (as revised in 2013). Written informed consent was obtained from all patients or their legally authorized representative. Institutional ethical approval was waived.
Open Access Statement: This is an Open Access article distributed in accordance with the Creative Commons Attribution-NonCommercial-NoDerivs 4.0 International License (CC BY-NC-ND 4.0), which permits the non-commercial replication and distribution of the article with the strict proviso that no changes or edits are made and the original work is properly cited (including links to both the formal publication through the relevant DOI and the license). See: https://creativecommons.org/licenses/by-nc-nd/4.0/.
References
- Luan Y, Li H. Clustering of time-course gene expression data using a mixed-effects model with B-splines. Bioinformatics 2003;19:474-82. [PubMed]
- Eisen MB, Spellman PT, Brown PO, et al. Cluster analysis and display of genome-wide expression patterns. Proc Natl Acad Sci U S A 1998;95:14863-8. [PubMed]
- Tavazoie S, Hughes JD, Campbell MJ, et al. Systematic determination of genetic network architecture. Nat Genet 1999;22:281-5. [PubMed]
- Tamayo P, Slonim D, Mesirov J, et al. Interpreting patterns of gene expression with self-organizing maps: methods and application to hematopoietic differentiation. Proc Natl Acad Sci U S A 1999;96:2907-12. [PubMed]
- Fraley C, Raftery AE. Model-based clustering, discriminant analysis, and density estimation. J Am Stat Assoc 2002;97:611-31.
- de Souto MC, Costa IG, de Araujo DS, et al. Clustering cancer gene expression data: a comparative study. BMC Bioinformatics 2008;9:497. [PubMed]
- Houseman EA, Christensen BC, Yeh RF, et al. Model-based clustering of DNA methylation array data: a recursive-partitioning algorithm for high-dimensional data arising as a mixture of beta distributions. BMC Bioinformatics 2008;9:365. [PubMed]
- Marsit CJ, Lambertini L, Maccani MA, et al. Placenta-imprinted gene expression association of infant neurobehavior. J Pediatr 2012;160:854-860.e2.
- Marsit CJ, Christensen BC, Houseman EA, et al. Epigenetic profiling reveals etiologically distinct patterns of DNA methylation in head and neck squamous cell carcinoma. Carcinogenesis 2009;30:416-22. [PubMed]
- Christensen BC, Houseman EA, Godleski JJ, et al. Epigenetic profiles distinguish pleural mesothelioma from normal pleura and predict lung asbestos burden and clinical outcome. Cancer Res 2009;69:227-34. [PubMed]
- Koestler DC, Marsit CJ, Christensen BC, et al. Semi-supervised recursively partitioned mixture models for identifying cancer subtypes. Bioinformatics 2010;26:2578-85. [PubMed]
- Marsit CJ, Koestler DC, Christensen BC, et al. DNA methylation array analysis identifies profiles of blood-derived DNA methylation associated with bladder cancer. J Clin Oncol 2011;29:1133-9. [PubMed]
- Christensen BC, Smith AA, Zheng S, et al. DNA methylation, isocitrate dehydrogenase mutation, and survival in glioma. J Natl Cancer Inst 2011;103:143-53. [PubMed]
- Coffey N, Hinde J. Analyzing time-course microarray data using functional data analysis - a review. Stat Appl Genet Mol 2011;10.
- Dempster AP, Laird NM, Rubin DB. Maximum likelihood from incomplete data via the EM algorithm. J R Stat Soc B 1977;39:1-38.
- Chen J. Optimal Rate of Convergence for Finite Mixture Models. Ann Stat 1995;23:221-33.
- van der Laan MJ, Pollard KS. A new algorithm for hybrid hierarchical clustering with visualization and the bootstrap. J Stat Plan Inference 2003;117:275-303.
- Laird NM, Ware JH. Random-effects models for longitudinal data. Biometrics 1982;38:963-74. [PubMed]
- Blashfield RK. Finding Groups in Data - an Introduction to Cluster-Analysis. Kaufman L, Rousseeuw PJ. J Classif 1991;8:277-9.
- Scharl T, Grü B, Leisch F. Mixtures of regression models for time course gene expression data: evaluation of initialization and random effects. Bioinformatics 2010;26:370-7. [PubMed]
- Rajicic N, Cuschieri J, Finkelstein DM, et al. Identification and interpretation of longitudinal gene expression changes in trauma. PLoS One 2010;5:e14380. [PubMed]
- Warren HS, Elson CM, Hayden DL, et al. A genomic score prognostic of outcome in trauma patients. Mol Med 2009;15:220-7. [PubMed]
- Rand WM. Objective Criteria for the Evaluation of Clustering Methods. J Am Stat Assoc 1971;66:846-50.
- Rajicic N, Finkelstein DM, Schoenfeld DA, et al. Survival analysis of longitudinal microarrays. Bioinformatics 2006;22:2643-9. [PubMed]
- Cox DR. Regression Models and Life-Tables. J R Stat Soc B 1972;34:187-220.
- Storey JD, Xiao W, Leek JT, et al. Significance analysis of time course microarray experiments. Proc Natl Acad Sci U S A 2005;102:12837-42. [PubMed]
- Yuan M, Kendziorski C, Li H, et al. Hidden Markov Models for Microarray Time Course Data in Multiple Biological Conditions J Am Stat Assoc 2006;101:1323-40. [with Discussions, Rejoinder].
- Zhang Y, Tibshirani RJ, Davis RW. Predicting patient survival from longitudinal gene expression. Stat Appl Genet Mol Biol 2010;9:Article41.
- Witten DM, Tibshirani R. A Framework for Feature Selection in Clustering. J Am Stat Assoc 2010;105:713-26. [PubMed]
- Witten DM, Tibshirani R. A framework for feature selection in clustering. J Am Stat Assoc 2010;105:713-26. [PubMed]
- Dy JG, Brodley CE, Wrobel S. Feature selection for unsupervised learning. J Mach Learn Res 2004;5:845-89.
- Schaafhausen A, Rost S, Oldenburg J, et al. Identification of VKORC1 interaction partners by split-ubiquitin system and coimmunoprecipitation. Thromb Haemost 2011;105:285-94. [PubMed]
- Khodr B, Khalil Z. Modulation of inflammation by reactive oxygen species: implications for aging and tissue repair. Free Radic Biol Med 2001;30:1-8. [PubMed]
- Gutiérrez-Fernández A, Inada M, Balbín M, et al. Increased inflammation delays wound healing in mice deficient in collagenase-2 (MMP-8). FASEB J 2007;21:2580-91. [PubMed]
- Bar-Joseph Z, Gerber GK, Gifford DK, et al. Continuous representations of time-series gene expression data. J Comput Biol 2003;10:341-56. [PubMed]
- Ma P, Castillo-Davis CI, Zhong W, et al. A data-driven clustering method for time course gene expression data. Nucleic Acids Res 2006;34:1261-9. [PubMed]

